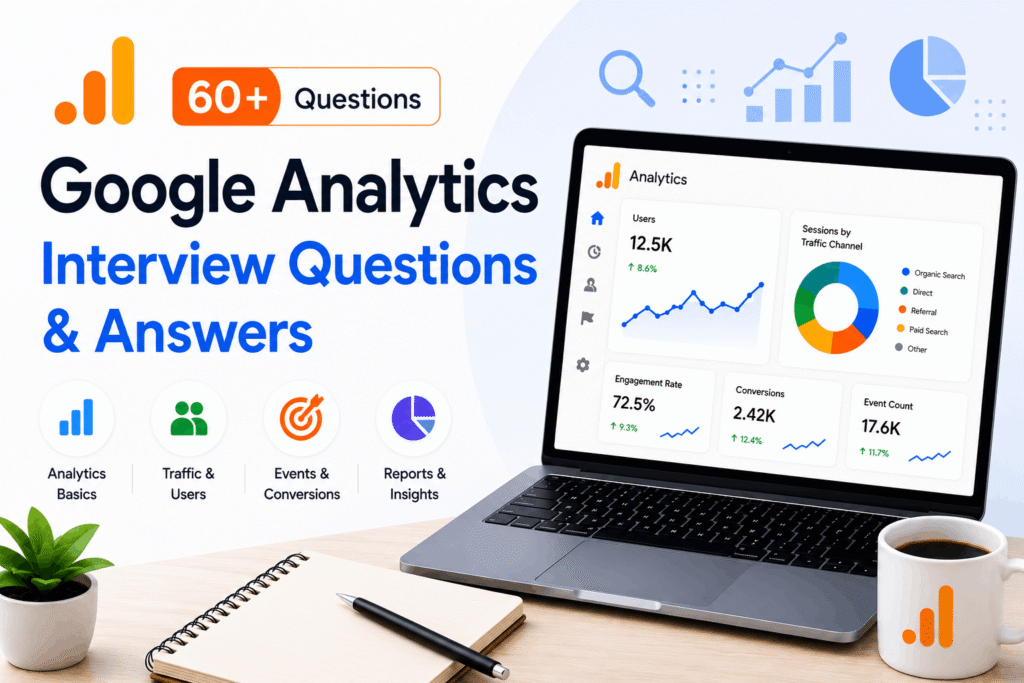
60+ Google Analytics Interview Questions and Answers (2026)
From beginner to advanced level — covering GA4, traffic analysis, conversions, reporting, tracking, and real-world interview questions.
Google Analytics is one of the most widely used web analytics tools for tracking website traffic, user behavior, conversions, and overall marketing performance. It helps businesses understand how visitors interact with their websites and provides valuable insights for improving user experience, content strategy, and marketing campaigns.
Whether you’re preparing for an SEO, Digital Marketing, Web Analytics, or Performance Marketing interview, a strong understanding of Google Analytics 4 (GA4) is essential. In this article, we’ve compiled 60+ Google Analytics interview questions and answers, covering beginner, intermediate, and advanced topics, along with practical scenario-based questions to help you prepare confidently for your next interview.
Google Analytics Basic Interview Questions
1. What is Google Analytics 4 (GA4)?
GA4 (Google Analytics 4) is the latest version of Google Analytics that helps businesses track and analyze user interactions across websites and mobile apps. Unlike Universal Analytics, which primarily focused on sessions and pageviews, GA4 uses an event-based data model to measure user behavior more accurately. It also supports cross-platform tracking, provides AI-powered insights, and offers enhanced privacy controls to help businesses better understand their customers and make data-driven decisions.
2. What is a “property” in GA4?
A GA4 property is the place where data from a website or app is collected, processed, and stored. When we set up Google Analytics 4, we create a property and connect it through data streams. User interactions such as page views, clicks, and purchases are tracked within it. One Google Analytics account can have multiple properties, so if a company has several websites or apps, each can have its own property for separate reporting and analysis.
3. What is an event in GA4?
An event in GA4 is any measurable action that a user performs on a website or app, such as viewing a page, clicking a button, scrolling, adding a product to a cart, or making a purchase. Since GA4 uses an event-based data model, every user interaction is recorded as an event, helping businesses better understand user behavior and engagement.
Examples of events include:
- page_view – when a page is viewed
- session_start – when a user starts a session
- scroll – when a user scrolls through a page
- click – when a user clicks a link or button
- add_to_cart – when a product is added to the cart
- purchase – when a transaction is completed
- video_start – when a video starts playing
- form_submit – when a form is submitted
4. What is a conversion in GA4?
- In GA4, a conversion is an event that has been marked as important to the business. For example, a purchase, form submission, newsletter signup, lead generation, or account registration can be tracked as a conversion.
- Every conversion is an event, but not every event is a conversion. We mark specific events as conversions when they represent a key business goal or success metric.
5. How many conversions can be created in GA4?
In standard GA4, you can create up to 30 conversions per property. In the paid GA4 360 version, the limit is increased to 50 conversions per property.
6. What are the different types of events in GA4?
GA4 has four main types of events:
- Automatically Collected Events – Events that GA4 tracks automatically, such as first_visit, session_start, and page_view.
- Enhanced Measurement Events – Events that can be enabled with a toggle, such as scroll, outbound_click, site_search, and video_engagement.
- Recommended Events – Predefined events suggested by Google for specific use cases, such as login, sign_up, purchase, and add_to_cart.
- Custom Events – Events created by users to track specific actions that are not covered by the other event types.
7. What are Data Streams in GA4?
Data streams in GA4 are the sources that send data to a GA4 property. A data stream can be a website, an iOS app, or an Android app. They collect user interaction data and send it to the connected GA4 property for reporting and analysis.
For example, a company can have one web data stream for its website and separate data streams for its iOS and Android apps, all connected to the same GA4 property.
8. How do you add GA4 tracking to a website?
There are two ways to add GA4 tracking to a website.
- First, you can add the GA4 tracking code directly by copying the gtag.js snippet from Google Analytics and placing it in the head section of the website.
- Second, and more commonly, you can use Google Tag Manager. In GTM, you create a GA4 Configuration tag, enter the Measurement ID provided by GA4, and publish the container. GTM is generally preferred because it makes tag management easier and avoids the need for code changes whenever tracking needs to be updated.
Once the tag is installed correctly, GA4 starts collecting data from the website.
9. What is a Measurement ID in GA4?
A Measurement ID is a unique identifier used by GA4 to collect data from a website or app and send it to the correct GA4 property. It is automatically generated when you create a data stream and typically starts with “G-” followed by a series of letters and numbers (for example, G-XXXXXXXXXX). The Measurement ID is used when installing the GA4 tracking tag on a website.
10. What is the difference between GA4 and Google Tag Manager (GTM)?
GA4 and Google Tag Manager (GTM) serve different purposes.
- GA4 is an analytics platform that collects, measures, and reports data about user behavior on a website or app.
- GTM, on the other hand, is a tag management tool used to deploy and manage tracking codes, such as GA4 tags, without directly editing the website’s code.
In simple terms, GTM helps send data, while GA4 helps analyze that data.
Metrics & Dimensions Interview Questions
11. What are dimensions in GA4?
Dimensions in GA4 are descriptive attributes that provide more details about users, events, or traffic sources. They help organize data and make reports easier to analyze.
Examples of dimensions include:
- Page title
- Country
- Device category
- Traffic source
- Event name
12. What are metrics in GA4?
Metrics in GA4 are quantitative measurements that show the performance of users, events, or website activity. They are represented as numbers and are used to measure and analyze data in reports.
Examples of metrics include:
- Users
- Sessions
- Event count
- Conversions
- Revenue
- Engagement rate
13. What is “Engaged Session” in GA4?
An engaged session in GA4 is a session that lasts longer than 10 seconds, has at least one conversion event, or includes two or more page or screen views. It is used to measure meaningful user engagement rather than just visits.
14. What is a custom dimension in google analytics?
A custom dimension in GA4 is a user-defined attribute that allows businesses to collect and analyze data that is not tracked by default. It helps capture additional information about users, events, or items based on specific business requirements.
For example, a business might create custom dimensions to track membership level, content category, author name, or customer type.
15. What is engagement rate in GA4?
- Engagement rate in GA4 is the percentage of sessions that are considered engaged sessions. An engaged session is one that lasts longer than 10 seconds, has at least one conversion event, or includes two or more page or screen views.
- A higher engagement rate generally indicates that users are actively interacting with a website or app.
- Engagement Rate = Engaged Sessions / Total Sessions × 100
16. What is bounce rate in GA4?
- Bounce rate in GA4 is the percentage of sessions that were not engaged. In other words, it represents the percentage of visitors who left a website without having an engaged session.
- Since GA4 focuses on engagement, bounce rate is calculated as the opposite of the engagement rate.
- Formula: Bounce Rate = 100 – Engagement Rate
17. What is a session in GA4?
- A session in GA4 is a group of user interactions that take place on a website or app within a given period of time. A session begins when a user starts interacting with the site or app and is recorded through the session_start event.
- During a session, users may perform actions such as viewing pages, clicking links, scrolling, or making purchases.
18. What is the difference between a metric and a dimension in GA4?
- In GA4, dimensions and metrics work together to analyze data. A dimension is a descriptive attribute that provides details about the data, while a metric is a numerical measurement that quantifies the data.
- For example, Country is a dimension because it describes where users are from, while Users is a metric because it shows the number of users from each country.
19. What are the types of custom dimensions in GA4?
GA4 supports three types of custom dimensions:
- User-scoped custom dimensions – Describe characteristics of users, such as membership level or customer type.
- Event-scoped custom dimensions – Describe specific events, such as article category, button name, or form type.
- Item-scoped custom dimensions – Describe products or items in e-commerce tracking, such as product color, size, or brand.
20. What is the default session timeout in GA4?
The default session timeout in GA4 is 30 minutes of inactivity. If a user does not interact with the website or app for 30 minutes, the current session ends, and any new activity starts a new session. This timeout can be customized in the GA4 property settings if needed.
21. What is Sessions per User in GA4?
- Sessions per User in GA4 is a metric that shows the average number of sessions generated by each user. It is calculated by dividing the total number of sessions by the total number of users.
- This metric helps measure how often users return to and interact with a website or app.
22. What is the difference between page_view, session_start, and first_visit events?
These are all automatically collected events in GA4, but they track different user actions:
- page_view – Triggered whenever a user views a page on a website.
- session_start – Triggered when a new session begins.
- first_visit – Triggered the first time a user visits a website.
For example, a new visitor landing on a page may trigger all three events: first_visit, session_start, and page_view.
Reports & Dashboards Questions
23. What are the main sections in the GA4 interface?
The main sections in the GA4 interface are:
- Home
- Reports
- Explore
- Advertising
- Admin
These sections are used to view analytics data, perform advanced analysis, measure advertising performance, and manage GA4 settings.
24. What is Real-Time Report in GA4?
The Real-Time Report in GA4 shows user activity on a website or app as it happens. It provides data from the last 30 minutes, including active users, traffic sources, pages viewed, events triggered, and conversions.
It is commonly used to verify tracking setup, monitor live campaigns, and observe current user behavior.
25. What are the main report sections in GA4?
The main report sections in GA4 are:
- Realtime – Shows user activity on a website or app in real time.
- Acquisition – Shows how users arrive at a website or app.
- Engagement – Shows how users interact with content and events.
- Monetization – Provides revenue and e-commerce performance data.
- Retention – Shows how well users return over time.
- Demographics – Provides information about user characteristics such as age, gender, and interests.
- Tech – Shows details about devices, browsers, and platforms used by visitors.
26. What is the difference between Acquisition, Engagement, and Retention reports?
- Acquisition reports show where users come from, such as organic search, paid ads, social media, or referral traffic.
- Engagement reports show what users do after arriving on a website or app, including the pages they visit, the events they trigger, their engagement time, and conversions.
- Retention reports show how well users are retained by measuring how many of them return and continue using the website or app over time.
- Together, these reports help answer three key questions: Where did users come from? What did they do? Did they come back?
27. What is the “Explore” section used for?
The Explore section in GA4 is used for advanced data analysis and custom reporting. It allows users to create customized reports, perform deeper analysis, and uncover insights that may not be available in standard reports.
Some popular exploration techniques include Free Form, Funnel Exploration, Path Exploration, Segment Overlap, and Cohort Analysis.
28. What is Path Exploration in GA4?
Path Exploration in GA4 is an analysis technique in the Explore section that shows the sequence of actions users take on a website or app. It helps track the paths users follow before or after a specific event, page, or screen.
This report is useful for understanding user behavior, identifying common navigation patterns, and finding points where users drop off.
29. What is Funnel Exploration in GA4?
Funnel Exploration in GA4 is an analysis technique in the Explore section that helps track how users move through a series of steps toward a goal. It shows how many users complete each step and where they drop off during the process.
It is commonly used to analyze user journeys such as signups, lead generation, or purchase funnels.
30. What is Cohort Exploration used for?
Cohort Exploration in GA4 is used to analyze the behavior of a group of users who share a common characteristic, such as the date they first visited a website or app. It helps measure retention and understand how user behavior changes over time. By comparing different cohorts, it’s possible to evaluate user engagement, loyalty, and the effectiveness of marketing campaigns.
31. What is Funnel Exploration in GA4?
- Funnel Exploration in GA4 is used to analyze the steps users take to complete a specific goal or conversion. It helps identify where users drop off in the journey and which steps have the highest abandonment rates. This allows businesses to optimize the user experience and improve conversion rates.
- For example, in an e-commerce website, a funnel might include: View Product → Add to Cart → Begin Checkout → Purchase. Funnel Exploration shows how many users complete each step and where they exit the process.
32. How do you share reports in GA4?
- Reports in GA4 can be shared in several ways. Standard reports and explorations can be exported as PDF or CSV files and shared with stakeholders. Access can also be granted directly to users by adding them to the GA4 property with the appropriate permissions.
- For custom analysis in the Explore section, explorations can be shared with other users who have access to the same GA4 property.
- For more advanced reporting and visualization, GA4 data can also be connected to Looker Studio to create interactive dashboards that can be shared with teams or clients.
33. What is Comparisons in GA4 standard reports?
Comparisons in GA4 standard reports are used to compare different groups of users within the same report. They allow analysts to apply filters and view metrics side by side for different segments, such as mobile vs. desktop users, new vs. returning users, or users from different traffic sources.
This helps identify differences in behavior, engagement, conversions, and other key metrics without needing to create a separate exploration report.
Audiences & Segments Interview Questions
34. What is an audience in GA4?
- An audience in GA4 is a group of users who share specific characteristics or behaviors. Audiences are created using conditions based on user actions, demographics, traffic sources, or other criteria. They help businesses analyze specific user segments and can also be used for remarketing and targeted advertising.
- For example, an audience can be created for users who added products to the cart but did not complete a purchase, or for users who visited the website multiple times in the last 30 days.
35. What are predictive audiences in GA4?
- Predictive audiences in GA4 are audiences that are created using Google’s machine learning models. GA4 analyzes historical user behavior and predicts which users are likely to perform a specific action in the future, such as making a purchase or stopping their engagement.
- These audiences help businesses target users more effectively and improve marketing performance by focusing on users who are most likely to convert or churn.
- To generate predictive audiences, the GA4 property must have sufficient historical user and conversion data so that the machine learning models can make accurate predictions.
36. How do you create an audience in GA4?
- To create an audience in GA4, go to Admin → Audiences and click “New Audience“. An audience can be created from a predefined template or built from scratch by defining specific conditions based on user behavior, events, demographics, or traffic sources.
- Once the audience is saved, GA4 automatically adds users who meet those conditions and updates the audience over time.
- For example, an audience can be created for users who added a product to the cart but did not complete a purchase, or for users who visited the website more than three times in the last 30 days.
37. What is a Segment in GA4?
A segment in GA4 is a subset of users, sessions, or events that share specific characteristics or behaviors. Segments are used to analyze and compare different groups of data within the Explore section. They help identify patterns, understand user behavior, and compare performance between different groups.
For example, a segment can be created for mobile users, returning users, users from organic search, or users who completed a purchase.
Types of segments in GA4
- User Segments – Based on users and their behavior across multiple sessions.
- Session Segments – Based on specific sessions.
- Event Segments – Based on individual events.
38. What is the difference between a Segment and an Audience in GA4?
Segments are used to analyze data, whereas Audiences are used to track and target users. Segments are temporary for analysis, while Audiences are continuously updated and can be used for remarketing.
GA4 E-commerce Questions
39. What are the standard ecommerce events in GA4?
Some standard e-commerce events in GA4 are view_item, add_to_cart, begin_checkout, add_payment_info, and purchase. These events help track the customer’s journey from viewing a product to completing a purchase.
40. How do you avoid duplicate purchase tracking in GA4?
Duplicate purchase tracking is avoided by sending a unique transaction_id with every purchase event and ensuring the purchase tag fires only once on the confirmation page.
41. How is revenue tracked in GA4 reports?
Revenue is tracked using the purchase event and its parameters, such as value, currency, and transaction_id. GA4 uses these parameters to calculate metrics like Total Revenue, Purchase Revenue, and Average Purchase Revenue.
Users & Sessions Questions
42. What is the difference between Users and Sessions in GA4?
A User represents an individual visitor, while a Session represents a visit or a period of activity by that user. One user can have multiple sessions if they visit the website or app multiple times.
Example: If one person visits a website twice in a day, GA4 counts it as 1 user and 2 sessions.
43. What is the difference between Active Users and Total Users?
- Active Users are users who had an engaged session or meaningful interaction with a website or app during the selected time period.
- Total Users include all users who visited the website or app, regardless of how much they interacted.
44. What is Sessions per User?
Sessions per User is the average number of sessions generated by each user and is calculated by dividing total sessions by total users. It helps measure user engagement and repeat visits.
Sessions per User = Total Sessions ÷ Total Users
Example: If a website has 1,000 sessions and 500 users, the Sessions per User metric would be 2. This means, on average, each user visited twice during the selected period.
Traffic Acquisition & Attribution Questions
45. What is User Acquisition Report?
- The User Acquisition Report in GA4 shows how new users first discovered and arrived at a website or app. It helps identify which channels, sources, and campaigns are bringing in new users.
- The report is based on the user’s first interaction and typically uses dimensions such as First User Source, First User Medium, and First User Default Channel Group.
- For example, the report can show how many new users were acquired through Organic Search, Paid Search, Social Media, or Referral traffic.
46. What is Traffic Acquisition Report?
- The Traffic Acquisition Report in GA4 shows where website or app traffic comes from at the session level. It helps analyze which channels, sources, and campaigns are driving sessions, engagement, conversions, and revenue.
- Unlike the User Acquisition Report, which focuses on how users were first acquired, the Traffic Acquisition Report focuses on how each session was acquired.
47. What is Attribution in GA4?
- Attribution in GA4 is the process of assigning conversion credit to the marketing channels and touchpoints that contributed to a user’s conversion.
- For example, a user might first discover a website through Organic Search, return through a Social Media campaign, and finally convert through a Paid Search ad. Attribution determines how much credit each channel receives for that conversion.
48. What are Default Channel Groups in GA4?
Default Channel Groups are predefined traffic categories in GA4 that group sources and mediums into channels such as Organic Search, Paid Search, Direct, Social, Email, and Referral for easier reporting and analysis.
49. What is Direct Traffic?
Direct Traffic is traffic for which no identifiable source or referral information is available. It usually comes from users typing the URL directly, using bookmarks, or from untracked sources.
50. What are UTM Parameters?
UTM parameters are tracking tags added to URLs that help GA4 identify the source, medium, and campaign responsible for website traffic.
The most commonly used UTM parameters are:
- utm_source – identifies the traffic source (e.g., Google, Facebook)
- utm_medium – identifies the marketing medium (e.g., CPC, Email, Social)
- utm_campaign – identifies the campaign name
- utm_term – tracks keywords (mainly for paid search)
- utm_content – distinguishes different ads or links within the same campaign
Advanced GA4 Questions
51. What is DebugView in GA4?
DebugView in GA4 is a real-time debugging tool used to verify that events and parameters are being collected correctly. It allows to see incoming events as they happen and helps troubleshoot tracking issues during implementation.
DebugView is commonly used when setting up GA4 through Google Tag Manager or gtag.js to ensure that events, conversions, and custom parameters are firing correctly before publishing changes.
52. What is Tag Assistant?
Tag Assistant is a Google debugging tool used to test and validate tracking tags on a website. It helps verify whether tags such as GA4, Google Tag Manager, and Google Ads are installed correctly and firing as expected.
It is commonly used during implementation and troubleshooting to identify issues with tags, triggers, events, and data collection.
53. How do you test events in GA4?
Events in GA4 are typically tested using DebugView and Tag Assistant. DebugView shows events in real time, while Tag Assistant helps verify that tags are firing correctly and sending data to GA4.
54. What is Cross-Domain Tracking?
Cross-Domain Tracking allows GA4 to track users across multiple domains as a single user and session, providing a complete view of the customer journey. Without Cross-Domain Tracking, GA4 may treat visits across different domains as separate users or sessions, leading to inaccurate reporting.
55. What is Google Signals?
Google Signals is a GA4 feature that provides cross-device insights and additional demographic and interest data by using information from signed-in Google users who have Ads Personalization enabled.
56. What is BigQuery Integration in GA4?
- BigQuery Integration in GA4 allows businesses to export raw GA4 data directly to BigQuery for advanced analysis and reporting. It provides access to event-level data, enabling users to perform custom queries, create dashboards, and combine GA4 data with data from other sources.
- This integration is commonly used for large-scale analysis, data warehousing, and business intelligence reporting.
57. What are Annotations in GA4?
Annotations are notes added to GA4 reports to highlight important events or changes that may impact analytics data and provide context for reporting.
58. How do you handle cookie consent and GDPR compliance in GA4?
GDPR compliance in GA4 is typically handled by obtaining user consent through a cookie consent banner and using features such as Consent Mode and data retention controls to manage data collection according to user preferences.
59. What is Server-Side Tagging?
- Server-Side Tagging is a setup where tracking data is sent first to a server container instead of directly from the user’s browser to analytics and marketing platforms. The server then processes and forwards the data to tools such as GA4 and Google Ads.
- This approach provides better control over data collection, improves privacy, enhances security, and can help improve data quality and website performance.
GA4 Scenario-Based Interview Questions
60. How do you reduce spam traffic in GA4?
To reduce spam traffic in GA4, internal and developer traffic should be filtered, unwanted referrals should be excluded, and traffic sources should be monitored regularly to identify suspicious activity.
61. How would you implement GA4 from scratch?
To implement GA4 from scratch, first create a GA4 property and set up the required data streams for the website or app. Next, install the GA4 tracking tag directly on the site or through Google Tag Manager. After that, configure events, conversions, and any custom dimensions or custom metrics needed for reporting. Finally, test the implementation using DebugView and the Realtime report to ensure data is being collected correctly.
62. A button click is not appearing in GA4. What would you do?
- If a button click is not appearing in GA4, I would first verify whether the click event is being triggered using Google Tag Manager Preview Mode or GA4 DebugView.
- Next, I would check that the GA4 tag and event configuration are correct and that the event is being sent to the correct GA4 property.
- I would also review any trigger conditions, filters, or consent settings that might be preventing the event from firing.
- Finally, I would confirm the event appears in Realtime reports and standard reports after processing.
63. Revenue numbers in GA4 are different from Shopify. Why?
Revenue numbers in GA4 and Shopify can differ because of attribution differences, time zone settings, tracking issues, refunds, currency settings, or missing purchase events. Shopify records actual store transactions, while GA4 reports revenue based on its tracking and attribution model.
64. A purchase event is firing twice. How would you fix it?
I would use GTM Preview Mode and GA4 DebugView to identify the source of the duplicate event. I would check whether the purchase event is being sent through multiple tags, duplicate triggers, or both GTM and hardcoded tracking. I would also verify that the event is firing only once per transaction and review the transaction ID implementation to prevent duplicate purchases from being recorded.
65. Traffic suddenly drops by 50%. How would you investigate?
- If traffic suddenly drops by 50%, I would first verify that GA4 tracking is working correctly by checking Realtime reports, DebugView, and recent implementation changes.
- Next, I would compare traffic across channels, pages, devices, and locations to identify where the drop occurred.
- I would also review Google Search Console, advertising platforms, website uptime, and any recent website updates that could have affected traffic.
- This helps determine whether the issue is caused by tracking problems or an actual decline in traffic.
66. How would you track a form submission that does not redirect to a thank-you page?
I would track the form submission using a custom event triggered by the form submission, submit button, or success message. I would then verify the event in GTM Preview Mode and GA4 DebugView.
67. How would you identify where users drop off during checkout?
- To identify where users drop off during checkout, I would use Funnel Exploration in GA4 and create a funnel that includes each step of the checkout process.
- By analyzing the funnel, I can see how many users move from one step to the next and identify the stages where the highest drop-off occurs.
- I would then investigate those steps to understand potential issues affecting conversions.
68. How would you exclude internal company traffic?
To exclude internal company traffic in GA4, I would define internal traffic by adding the company’s IP addresses in the Data Stream settings. Then, I would create a data filter to exclude that internal traffic from reports. This ensures that employee visits do not affect analytics data.
69. How do you ensure accurate ecommerce tracking?
To ensure accurate ecommerce tracking, I would verify that all ecommerce events are implemented correctly and follow GA4’s recommended ecommerce event structure. I would test events such as view_item, add_to_cart, begin_checkout, and purchase using GTM Preview Mode and GA4 DebugView. I would also validate transaction IDs, revenue values, product data, and conversions to ensure data is being collected accurately and without duplication.
Interview Tips: How to Answer GA4 Questions
Use the following approach when answering GA4 interview questions:
- Define it simply: Start with a clear, one-sentence explanation of the concept.
- Provide context: Explain when, why, or how the feature is used in a real-world scenario.
- Mention GA4 differences: If the concept differs from Universal Analytics, briefly highlight the change.
- Keep it conversational: Focus on understanding the concept rather than memorizing answers word-for-word.
- Use examples: Practical examples make your answers more convincing and easier for interviewers to follow.
- Discuss implementation: For experienced roles, be prepared to explain how you have implemented or troubleshot the feature in real projects.
Conclusion
Success in a Google Analytics interview goes beyond simply memorizing definitions. Interviewers look for a practical understanding of how GA4 is used to track user behavior, measure performance, and support business decisions. Combining strong GA4 fundamentals with hands-on experience will help you confidently answer both conceptual and real-world scenario-based questions.
Related Resources
- SEO Interview Questions
- WordPress Interview Questions
- Digital Marketing Interview Questions
- SMM Interview Questions
- Google Ads Interview Questions